

This guide breaks down what drivers are typically paying per month in 2026, why your own quote can look nothing like a published “average,” and how to read a monthly premium the way an insurance underwriter does rather than the way a headline presents it.
Opening Cost Snapshot: What Does Car Insurance Cost Per Month Right Now?
There is no single monthly price that applies to every driver in the country. Insurers price policies individually, based on the driver, the vehicle, the coverage selected, and the ZIP code where the car is garaged. That said, several independent data providers publish national averages that give a useful starting point.
According to Experian’s 2026 marketplace data, the national average cost of car insurance is $2,262 annually, or about $188 per month, with minimum coverage averaging roughly $132 per month and full coverage averaging around $243 per month. Insurify’s September 2026 rate tracker puts the figures slightly differently, reporting a nationwide average of $187 per month for full coverage and $98 per month for liability-only coverage, based on an analysis of more than 250 million quotes across its partner network. Insurance.com’s 2026 analysis, based on a sample 40-year-old driver with a clean record, found an average full-coverage cost of about $209 per month, or $2,513 per year, while ValuePenguin’s 2026 report calculated an average of $208 per month for full coverage.
These figures were compiled from data published through mid-to-late 2026 and generally reflect either full-coverage policies (which include comprehensive and collision) or liability-only policies (which cover only damage you cause to others). None of these organizations claim their number is “the” price every American pays — it’s a market average built from a specific sample driver profile, and your own quote can land well above or below it.
The practical range worth remembering: liability-only coverage generally runs somewhere in the neighborhood of $75 to $100 per month nationally, while full coverage tends to land between roughly $185 and $245 per month, depending on the data source and month it was published. State averages can push both figures much higher or lower, which we’ll cover shortly.
| Data Source (2026) | Liability-Only (Monthly) | Full Coverage (Monthly) |
|---|---|---|
| Experian | ~$132 | ~$243 |
| Insurify | ~$98 | ~$187 |
| Insure.com | Not separately reported | ~$209 |
| ValuePenguin | Not separately reported | ~$208 |
Notice how the full-coverage figures cluster in a fairly tight band, even though each company used a different sample driver and pulled data at a slightly different point in the year. That consistency is useful — but it still tells you nothing about what an insurer will actually quote you, which is the real question behind this search.
The Monthly Number Is Only the Starting Point
Before comparing quotes, it helps to separate a few terms that often get blended together in casual conversation.
- Premium: The total amount an insurer charges for a policy term, usually six or twelve months.
- Monthly payment: The premium divided into installments, sometimes with an added fee for paying that way instead of in one lump sum.
- Policy fee: A flat administrative charge some insurers add on top of the premium, separate from the cost of coverage itself.
- Down payment: An upfront amount due when a policy starts, which is often larger than the following monthly installments.
- Taxes and surcharges: State-specific charges that some jurisdictions add to auto policies.
- Installment charges: A per-payment fee some carriers apply for splitting an annual premium into monthly pieces.
Here’s why this distinction matters. If your six-month premium is $1,200, dividing it evenly gives you $200 per month. But if your insurer charges a $5 monthly installment fee, your actual out-of-pocket cost is $205 per month — a small difference, but one that can make an advertised “average” look inaccurate when compared to your own bill. Paying the premium in full up front, when a household can afford it, often avoids these installment charges entirely.
The “Same Car, Different Driver” Problem
Imagine two neighbors, both driving a 2022 Toyota Camry, both carrying full coverage, both living on the same street. One pays around $140 a month. The other pays close to $260 a month for what looks, on paper, like a nearly identical policy.
What could explain that gap? Possibly one driver has a decade of clean driving history while the other had an at-fault accident two years ago. Maybe one drives 6,000 miles a year for a short commute, while the other drives 18,000 miles annually for work. Perhaps their credit-based insurance scores differ in states where that factor is permitted, or one qualifies for a multi-policy discount by bundling home and auto coverage.
This scenario illustrates the core idea behind car insurance pricing: insurers are not pricing the car. They are pricing the risk that a specific driver, in a specific vehicle, in a specific location, will file a claim. Two nearly identical vehicles can carry very different price tags once you factor in the human being behind the wheel.
The Driver Profile Layer
Insurers evaluate a range of driver-specific variables when calculating a premium. Not every insurer weighs every factor the same way, and some factors are restricted or banned outright in certain states, but the following tend to matter broadly:
- Age and driving experience: Newer and younger drivers statistically file more claims, which typically pushes premiums higher until a driver builds a longer track record.
- Driving record: Tickets, at-fault accidents, and DUIs generally raise premiums, often for three to five years depending on the state and violation.
- Claims history: A pattern of prior claims — even smaller ones — can signal higher future risk to an underwriter.
- Annual mileage: More time on the road generally correlates with more exposure to accidents, so low-mileage drivers can sometimes see lower rates.
- Prior insurance history: Drivers with continuous coverage often pay less than those with a lapse in coverage, which some insurers treat as a risk signal.
- Marital status: In many states, married drivers statistically file fewer claims, which can factor into pricing where allowed.
- Credit-based insurance scores: In most states, insurers may use a credit-based score as one pricing input, drawing on payment history and other credit-report data rather than a traditional credit score, according to the Insurance Information Institute. California, Hawaii, Massachusetts, and Michigan prohibit this practice entirely, while a handful of other states, including Maryland and Oregon, restrict how insurers can use it — so this factor does not apply uniformly nationwide.
No single factor determines a price in isolation. Underwriters typically combine several of these variables into a composite risk profile, which is one reason two drivers with one similar trait (say, the same age) can still see very different quotes once every other factor is layered in.
The Location Layer
Where a car is garaged overnight has a measurable effect on premiums, sometimes a larger one than people expect. Insurance regulators require rates to reflect risk within each state, and that risk varies by ZIP code, not just by state line.
Several location-based variables commonly influence pricing:
- Local accident frequency and severity
- Vehicle theft rates in the area
- Population density and traffic congestion
- Weather exposure, including hail, flooding, or severe storms
- Local repair and medical costs
- State minimum coverage requirements and legal liability rules
- State-level regulation of pricing factors (some states restrict what insurers can use)
State law also sets a floor before any of the above even comes into play. According to the Insurance Information Institute, 49 states and the District of Columbia require drivers to carry auto liability insurance, with New Hampshire the sole exception; a common minimum standard adopted by several states is 25/50/25 coverage (meaning $25,000 in bodily injury liability per person, $50,000 per accident, and $25,000 in property damage liability), though limits vary considerably by state.
Layered on top of that legal floor, the state-to-state cost gap can be dramatic. Experian’s 2026 data shows full-coverage averages ranging from a low of about $1,557 annually in Vermont to a high of $4,181 annually in Maryland, with Connecticut and New York also ranking among the most expensive states. Insurify’s separate 2026 tracker similarly places Maryland, Rhode Island, and Washington, D.C. among the priciest markets, with monthly full-coverage averages exceeding $250, versus roughly $84 in New Hampshire.
This is exactly why a “national average” can feel disconnected from reality. If you live in one of the higher-cost states, an advertised average may look artificially cheap. If you live in a lower-cost state, that same average may look artificially expensive.
The Vehicle Layer
The car itself is a pricing input independent of who’s driving it. Underwriters look at how expensive a vehicle is to repair or replace, how often that model is stolen, how it performs in crash tests, and how costly its parts are to source.
| Vehicle Characteristic | General Pricing Impact |
|---|---|
| High repair cost or specialty parts | Can push comprehensive and collision premiums higher |
| High theft rate for the model | Can increase comprehensive coverage cost specifically |
| Strong safety ratings and crash-avoidance tech | Can support lower premiums or qualify for safety discounts |
| High horsepower or performance trim | Often associated with higher premiums due to accident risk data |
| High replacement value (new or luxury vehicles) | Generally raises comprehensive and collision costs |
No vehicle type is universally “cheap” or “expensive” to insure across every driver and every insurer — a compact sedan can still price out higher than a larger vehicle if its claim history or theft statistics are worse in a given insurer’s data set. Vehicle-related pricing works alongside, not instead of, the driver and location factors already discussed.
The Coverage Layer
The specific protections you select have one of the largest direct effects on your monthly bill. Coverage requirements vary by state, so it helps to understand what each type generally protects before comparing prices.
| Coverage Type | What It Generally Covers |
|---|---|
| Liability (Bodily Injury & Property Damage) | Injuries or property damage you cause to others; required in nearly every state |
| Collision | Damage to your own vehicle from a crash, regardless of fault |
| Comprehensive | Non-collision damage, such as theft, vandalism, fire, or weather events |
| Uninsured/Underinsured Motorist | Costs from an accident caused by a driver with little or no insurance |
| Medical Payments / Personal Injury Protection | Medical costs for you and passengers, required or optional depending on the state |
| Optional Endorsements | Add-ons such as roadside assistance, rental reimbursement, or gap coverage |
Full coverage (liability plus comprehensive and collision) typically costs meaningfully more than liability-only coverage. Trusted Choice’s 2026 comparison found an average annual cost of $2,496 for full coverage versus $912 for minimum liability-only coverage, roughly a threefold difference, and Insurify’s data puts full coverage at about double the cost of liability-only nationally. If your vehicle is financed or leased, your lender will typically require full coverage regardless of what you’d otherwise choose.
The Coverage-to-Cost Tradeoff
Every coverage decision involves a balance between monthly cost and financial exposure. This is not a decision with one universally correct answer — it depends on your vehicle’s value, your savings, and your risk tolerance.
Choosing lighter coverage, such as state-minimum liability, generally lowers your monthly premium. But it also means you would be responsible for repairing or replacing your own vehicle out of pocket after an at-fault accident, theft, or weather event, since liability-only policies don’t cover your own car.
Choosing broader coverage, including comprehensive and collision, generally raises your monthly premium. In exchange, it typically protects your own vehicle’s value and can reduce how much you’d need to pay out of pocket after a covered loss.
Deductible selection is one part of this broader tradeoff — a higher deductible generally lowers your premium somewhat, while a lower deductible generally raises it. This article won’t dig deeply into deductible mechanics, since that comparison deserves its own dedicated breakdown; PolicyVila’s separate article on car insurance deductibles versus premiums covers that specific tradeoff in more depth if you want to go further into it.
Monthly Budget Reality Check: The “True Car Insurance Budget”
Most people budget for car insurance by looking at the premium alone. But the premium is rarely the only vehicle-related cost hitting a monthly budget. A more complete framework — call it your True Car Insurance Budget — accounts for everything connected to keeping a car insured and on the road.
- Insurance premium: The base cost of your policy.
- Payment frequency: Whether you’re billed monthly, every six months, or annually, and whether that frequency adds fees.
- Policy fees: Administrative charges some insurers apply regardless of payment schedule.
- Vehicle loan or lease payment: A separate monthly obligation that isn’t insurance but is often paid alongside it.
- Fuel costs: Variable, but a real monthly transportation expense.
- Maintenance: Routine upkeep that keeps a vehicle safe and road-legal.
- Registration and taxes: State-mandated costs tied to vehicle ownership.
- Expected out-of-pocket exposure: What you’d owe if you filed a claim, based on your deductible and coverage limits.
This framework isn’t meant to hand you exact dollar figures — those vary too much by household to generalize responsibly. It’s meant to widen the lens. A $180 monthly premium that looks perfectly affordable in isolation might strain a budget once it’s stacked against a car payment, fuel costs, and a $1,000 deductible sitting in reserve.
Quote Comparison Method: Comparing Apples to Apples
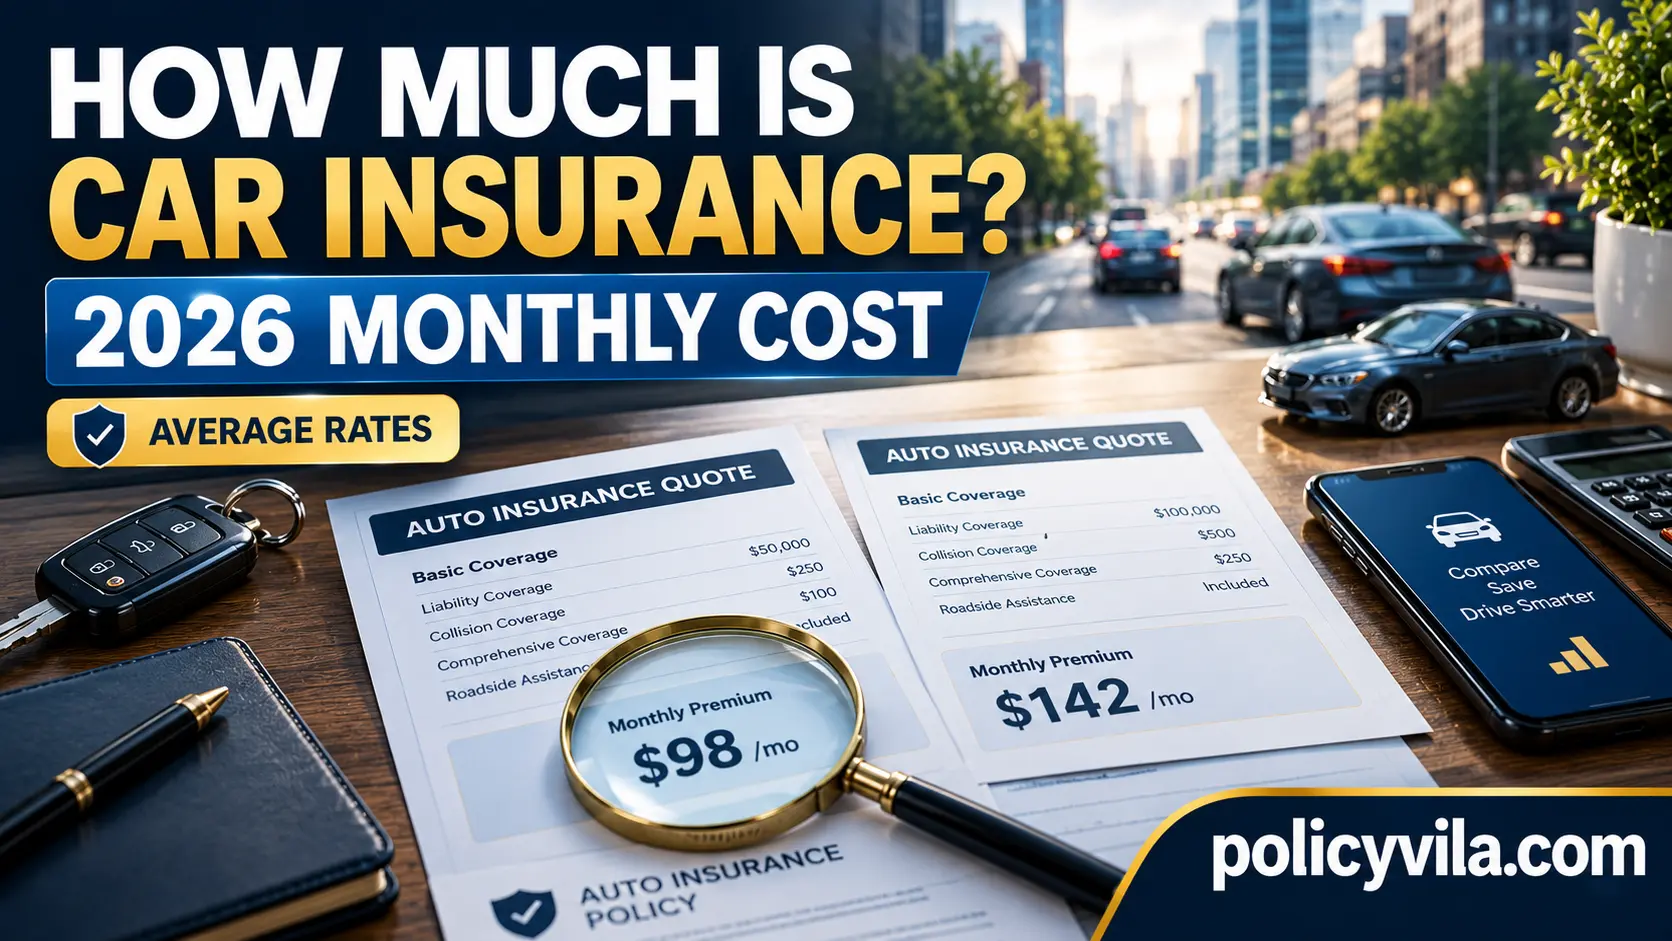
One of the most common mistakes in insurance shopping is comparing prices without confirming the underlying policies are actually equivalent. A $95-per-month quote and a $160-per-month quote aren’t meaningfully comparable if one carries state-minimum liability limits and the other includes full coverage with higher limits.
Before comparing any two quotes side by side, check that each one matches on:
- Liability limits (bodily injury and property damage amounts)
- Coverage types included (liability only vs. full coverage)
- Deductible amounts for comprehensive and collision
- Optional protections, such as rental reimbursement or roadside assistance
- Driver information listed on the policy (all household drivers, accurately reported)
- Vehicle information (correct make, model, year, and annual mileage estimate)
- Discounts applied or available (safe driver, multi-policy, good student, etc.)
- Payment terms (monthly installment fees, down payment requirements)
| Comparison Checklist Item | Why It Matters |
|---|---|
| Liability limits | Higher limits cost more but reduce personal financial exposure after a serious accident |
| Deductible amount | Directly affects both the premium and your out-of-pocket cost during a claim |
| Coverage type | Liability-only and full coverage aren’t interchangeable prices for the same protection |
| Discount eligibility | Two insurers may apply very different discounts to the same driver profile |
| Payment schedule fees | Can quietly raise the effective monthly cost above the quoted premium |
Requesting an itemized breakdown from each insurer, rather than just a bottom-line number, makes this comparison much easier to do accurately.

Why Your Quote May Be Higher Than an Online Average
It’s common to see a published average of roughly $200 a month for full coverage, then receive a personal quote for $310, and assume something has gone wrong. Usually nothing has — the two numbers simply represent different things.
- Published average: A statistical figure calculated from a large sample of policies or a single hypothetical driver profile, not from your specific situation.
- Advertised starting price: Often a “starting at” figure representing the lowest rate available to the lowest-risk applicants — not a typical price.
- Personalized quote: A price generated after an insurer reviews your actual driving record, vehicle, location, and coverage selections.
- Actual policy premium: The final price after underwriting confirms all details and applies eligible discounts — this is the number that appears on your bill.
AdvoraHQ’s 2026 review of multiple pricing sources makes this point directly, noting that full-coverage averages across major publishers ranged from roughly $177 to $244 a month because each source priced a different sample driver, vehicle, credit profile, and coverage limit — meaning no published average is “wrong,” they’re simply built on different assumptions. Treating any single average as your personal benchmark, rather than a rough starting point, is where most of the confusion around “why is my quote so high” tends to come from.
2026 Car Insurance Cost Scenarios
The following profiles are hypothetical illustrations, not market rates. They’re designed to show which direction various factors tend to push a premium, not to predict a specific dollar figure for any real driver.
- Young new driver (age 18, first year licensed): Limited driving history and statistically higher accident rates for new drivers tend to push premiums toward the higher end of the range, especially if the vehicle is titled solely in the young driver’s name rather than added to a parent’s policy.
- Experienced driver with a clean record (age 40s, 20+ years licensed): A long claims-free history and driving experience generally support lower-than-average pricing, all else being equal.
- Driver with a recent at-fault accident or ticket: A recent violation typically raises premiums for several years, with the exact surcharge and duration depending on the state and insurer.
- Urban driver in a high-traffic metro area: Greater accident frequency, higher theft rates, and more expensive local repair costs in dense urban areas tend to push premiums upward relative to a similar driver in a rural area.
- Low-mileage driver (under 6,000 miles per year): Reduced time on the road generally supports lower premiums and may qualify the driver for usage-based or low-mileage discounts where available.
- Older experienced driver (age 60s, clean record): Long driving experience typically supports competitive pricing, though rates can begin trending upward again in the most senior age brackets depending on the insurer’s data.
The common thread across every scenario: it’s the combination of factors, not any single trait, that ultimately determines where a real driver lands within the broader pricing range.
What Can Actually Lower Your Insurance Cost?
There’s no guaranteed formula for cutting a premium by a specific percentage, but several legitimate strategies tend to help across most driver profiles:
- Comparing multiple insurers: Because each company weighs risk factors differently, shopping around can surface meaningfully different quotes for the same coverage.
- Reviewing coverage needs periodically: A policy built years ago may no longer match your current vehicle value or financial situation.
- Asking about available discounts: Safe-driver, good-student, multi-policy, and low-mileage discounts vary by insurer and aren’t always applied automatically.
- Maintaining a clean driving record: Avoiding violations and at-fault claims over time generally supports more favorable pricing.
- Reviewing your mileage classification: If your commute or driving habits have changed, updating your estimated annual mileage with your insurer could better reflect your actual risk.
- Considering vehicle choice carefully: Before purchasing a car, checking how a specific make and model tends to be priced can avoid surprises later.
- Reviewing your policy annually: Rates and competitor pricing shift over time, so an annual comparison can catch savings you’d otherwise miss.
- Bundling policies where it makes financial sense: Combining home and auto coverage with one insurer sometimes — not always — results in a lower combined cost.
None of these strategies guarantees a specific savings amount, and what works well for one driver may not move the needle much for another. They’re worth exploring methodically rather than expecting a single tactic to solve the whole equation.
Mistakes That Make “Cheap” Insurance Expensive
A low monthly premium isn’t automatically a good deal. Several common mistakes can turn an apparently cheap policy into a costly one down the line:
- Comparing unequal coverage: Choosing the lowest number on the page without confirming it reflects the same coverage type and limits as competing quotes.
- Choosing a policy on price alone: Ignoring insurer claims-handling reputation or financial strength in favor of the cheapest sticker price.
- Ignoring policy fees: Overlooking installment or administrative fees that raise the real monthly cost above the advertised premium.
- Underestimating liability needs: Carrying only state-minimum limits when your assets or income could be exposed in a serious at-fault accident.
- Forgetting uninsured/underinsured motorist exposure: Skipping this coverage in states where it’s optional, despite the real possibility of being hit by an uninsured driver.
- Failing to update driver or vehicle information: Not reporting a household move, a new driver, or a vehicle change, which can lead to a denied claim or a rate correction later.
- Assuming a published average equals your personal quote: Treating a national or state average as a promise rather than a general benchmark.
Quick Decision Framework: Before Accepting a Monthly Car Insurance Quote, Check These 7 Things
- Confirm the coverage type. Make sure you know whether the quote is liability-only or full coverage.
- Check the liability limits. Compare bodily injury and property damage limits against your state’s requirements and your own risk tolerance.
- Review the deductible. Understand what you’d owe out of pocket before coverage kicks in on a claim.
- Ask about every fee. Request a breakdown separating the premium from policy fees and installment charges.
- Verify discounts were applied. Confirm any discounts you qualify for — safe driver, bundling, low mileage — are actually reflected in the price.
- Double-check driver and vehicle details. Make sure every listed driver, mileage estimate, and vehicle detail is accurate before you commit.
- Compare at least two more quotes. A single quote tells you very little about whether you’re getting a competitive price for your specific profile.

Frequently Asked Questions
How much is car insurance per month in 2026?
See the cost snapshot near the top of this guide for the specific 2026 figures from each major data provider. In short: liability-only coverage runs well below full coverage nationally, and your own quote depends heavily on your state, driving record, vehicle, and coverage choices.
What is the average monthly cost of full coverage?
Full-coverage averages from major 2026 sources cluster fairly close together nationally, though individual state averages swing much wider — some states run less than half the national figure, others run well above it.
Is car insurance cheaper if paid annually?
Often, yes — paying an annual premium in one lump sum can avoid the installment or processing fees some insurers charge for monthly billing. Whether this makes financial sense depends on your household cash flow.
Why is my car insurance so expensive?
Higher premiums are usually driven by a combination of factors: a recent violation or claim, a higher-risk location, a newer or more expensive vehicle, limited driving experience, or broader coverage with lower deductibles. Reviewing an itemized quote can help identify which factor is driving the cost.
Does age affect monthly car insurance?
Yes, generally. Younger and newer drivers tend to see higher premiums due to limited driving history, while experienced drivers with clean records often see more competitive pricing, though this can shift again in the most senior age brackets.
Does location affect insurance cost?
Significantly. State and even ZIP-code-level differences in accident rates, theft, weather exposure, and repair costs can cause the same driver and vehicle to be quoted very differently depending on address.
Does the car I drive affect my premium?
Yes. Repair costs, theft rates, safety ratings, and replacement value all factor into vehicle-specific pricing, independent of the driver behind the wheel.
Can a clean driving record lower insurance costs?
Generally, yes. A longer history free of at-fault accidents and violations tends to support more favorable pricing over time compared to a record with recent claims or tickets.
Does credit affect car insurance rates?
In most states, insurers are permitted to factor in a credit-based insurance score as part of pricing. California, Hawaii, Michigan, and Massachusetts prohibit this practice outright, and several other states limit how it can be used, so this varies by location.
Why are two quotes for the same car different?
Because insurers price the driver and the policy details, not just the vehicle. Differences in driving record, coverage limits, deductible, discounts, and even the specific insurer’s underwriting model can all produce different prices for an identical car.
Is monthly car insurance more expensive than paying every six months?
It can be, if the insurer applies an installment fee to monthly billing that isn’t charged on a six-month lump-sum payment. Ask your insurer directly whether a fee applies to your preferred payment schedule.
What should I compare besides the monthly premium?
Coverage type, liability limits, deductible amounts, included discounts, and any policy or installment fees. Comparing premiums alone can be misleading if the underlying policies aren’t equivalent.
How can new drivers estimate their insurance budget?
New drivers can expect to be priced toward the higher end of the national range due to limited driving history, and should request quotes that reflect their actual vehicle and coverage needs rather than relying solely on a general average.
Does a deductible affect the monthly premium?
Yes, generally — a higher deductible tends to correspond with a somewhat lower premium, and a lower deductible tends to raise it. This tradeoff is explored in more depth in PolicyVila’s dedicated article on car insurance deductibles versus premiums.
Can changing insurers lower my premium?
Sometimes. Because insurers weigh risk factors differently, switching carriers can occasionally produce a lower price for the same coverage, though results vary by individual driver profile and are not guaranteed.
Does a lapse in coverage affect a new quote?
Often, yes. Continuous coverage, even at minimum limits, is generally viewed more favorably by insurers than a gap in insurance history, and a lapse can push a new quote higher.
The Bottom Line on Monthly Car Insurance Costs
A published national average is a useful reference point, not a personal prediction. Where your own bill lands relative to the figures cited above depends on a layered combination of your driving history, your location, your vehicle, and the specific coverage you choose — not on any single number a headline can capture.
The most reliable way to understand your real cost isn’t to search for a single number online. It’s to request itemized quotes from several insurers, confirm they reflect equivalent coverage, and evaluate the total price against your actual budget — not just the advertised monthly figure.
Quotes vary by insurer, driver profile, and state. Averages cited above are drawn from published 2026 industry data and are provided for general educational purposes; they are not a quote or a guarantee of pricing for any individual driver.