

A bank balance alone reveals very little. Someone earning $150,000 a year can be financially stretched, while someone earning half that steadily builds wealth. The difference usually comes down to measurement — tracking the numbers that actually reveal financial health, rather than relying on a single snapshot. That’s what a personal finance dashboard is for.
Quick Answer
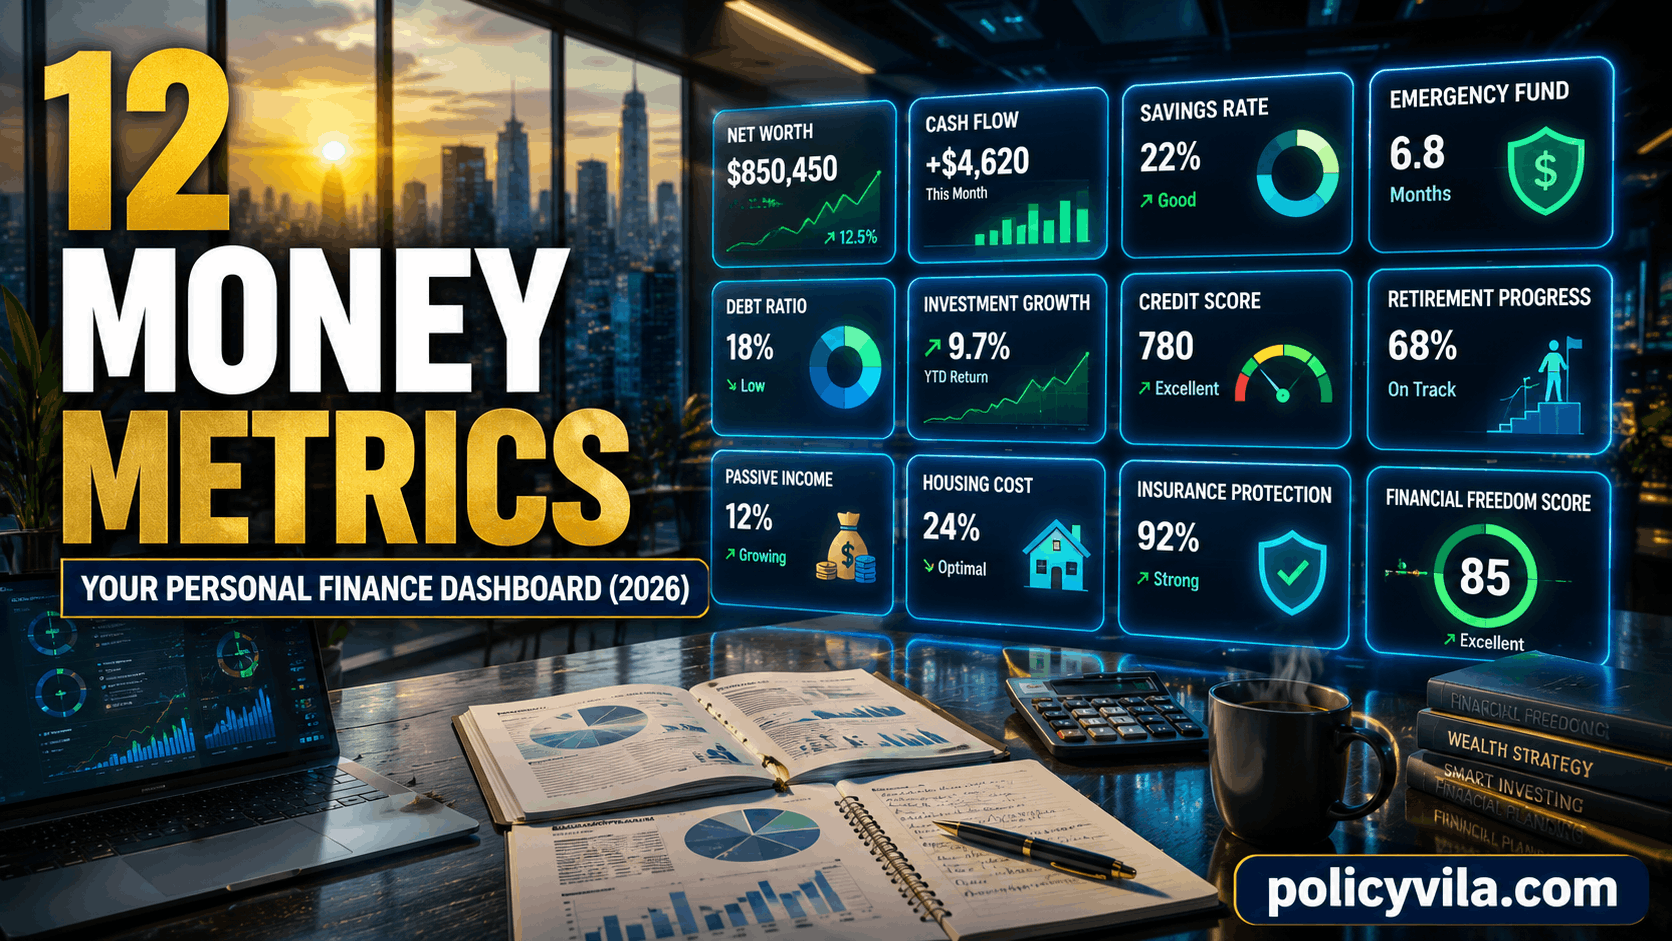
A personal finance dashboard is a set of 12 measurable financial indicators — cash flow, savings rate, emergency fund coverage, net worth growth, debt-to-income ratio, housing cost ratio, investment growth, retirement progress, passive income, insurance protection, and an overall financial freedom score — tracked together in one place. Reviewed monthly, it reveals whether your finances are improving or declining well before a problem becomes an emergency, in a way a bank balance alone can’t.
Why a Bank Balance Doesn’t Tell the Whole Story
Compare two households. Household A has $8,000 in checking, high credit card debt, no emergency fund, and minimal retirement savings. Household B has $2,500 in checking, no high-interest debt, a six-month emergency fund, and consistent retirement contributions. At a glance, Household A looks stronger — but Household B is likely in the far healthier position.
Income creates a similar illusion. High earners aren’t automatically wealthy; spending tends to rise with income, and larger homes, newer vehicles, and lifestyle upgrades can absorb a raise almost immediately. Meanwhile, moderate-income households that save and manage debt consistently often build more wealth over time. Even net worth alone can mislead — a homeowner’s property appreciation can mask poor cash flow, thin emergency savings, or insufficient insurance underneath a strong-looking number.
Budgeting helps, but it only answers one question: where is my money going. It doesn’t tell you whether you’re building wealth, whether debt is under control, or whether your financial position is improving. That broader picture is what a dashboard is built to provide — replacing guesswork and emotional decisions with a small set of numbers you actually check.

What a Personal Finance Dashboard Actually Is
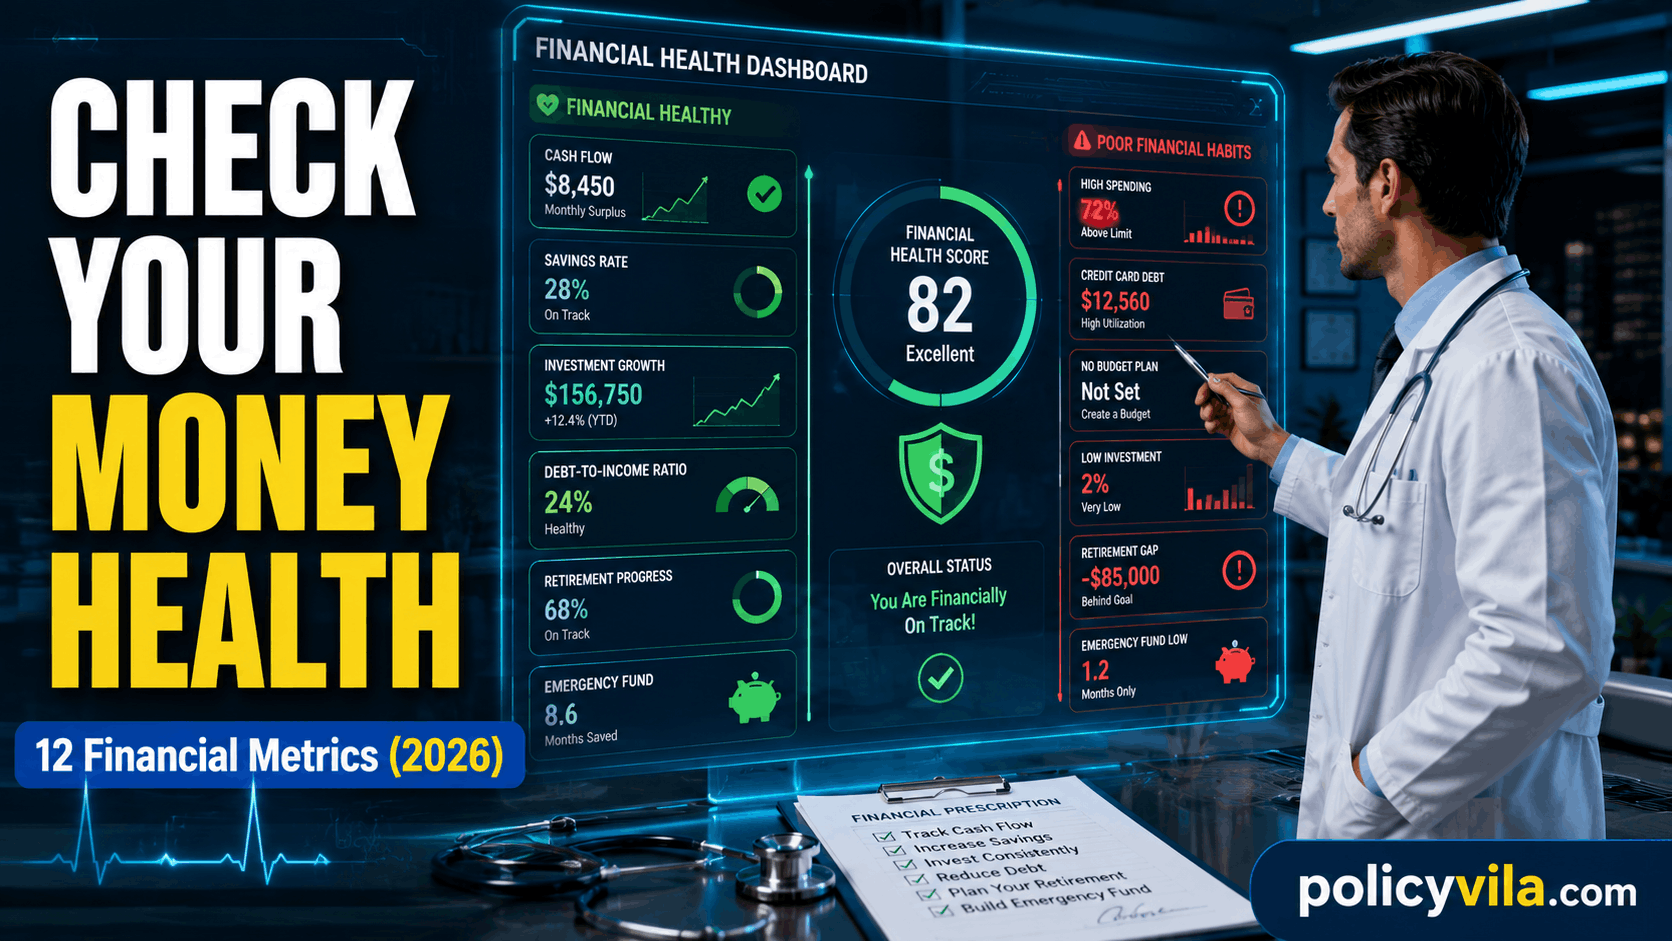
A personal finance dashboard tracks the financial numbers that matter most, in one place, the way a car dashboard shows speed, fuel, and warning lights rather than a single readout. Instead of reviewing a dozen scattered accounts and statements, you check a handful of metrics and can quickly answer questions like: is my financial position improving, am I saving enough, is my debt becoming a problem, am I prepared for emergencies.
The same logic already drives most successful organizations — businesses track revenue and margins, athletes track performance stats, doctors track vital signs. A dashboard isn’t about achieving a perfect score across every metric; it’s about awareness. Every meaningful financial improvement starts with an honest look at where things currently stand.
The 12 Metrics to Track
1. Monthly Cash Flow
Cash flow is the gap between what comes in and what goes out each month. A household earning $12,000 but spending $12,500 is in a weaker position than one earning $4,500 and spending $3,800 — income alone doesn’t determine financial health. Positive cash flow creates room to save, invest, and absorb the unexpected; negative cash flow tends to push a household toward debt and financial stress.
| Status | Monthly Cash Flow |
|---|---|
| Excellent | 20%+ of income remaining |
| Good | 10–20% remaining |
| Average | 5–10% remaining |
| Needs Improvement | Under 5% or negative |
Watch for: bills paid with credit cards, a shrinking bank balance, or consistently waiting on the next paycheck. To improve: review recurring expenses before making drastic changes — canceled subscriptions and renegotiated bills often move the needle more than people expect.
2. Savings Rate
Your savings rate measures financial discipline, not your account balance. Someone saving 20% of every paycheck often builds more long-term wealth than someone earning twice as much but saving very little.
| Status | Savings Rate |
|---|---|
| Excellent | 20–30% |
| Very Good | 15–20% |
| Good | 10–15% |
| Fair | 5–10% |
| Needs Improvement | Below 5% |
Watch for: only saving what’s left over, or a raise that immediately becomes a lifestyle upgrade. To improve: automate transfers right after payday instead of saving whatever remains at month’s end.
3. Emergency Fund Coverage
This measures how many months of essential expenses your savings could cover if income stopped. Job loss, medical bills, and major repairs rarely arrive with warning.
| Status | Emergency Savings |
|---|---|
| Excellent | 6–12 months of expenses |
| Good | 4–6 months |
| Fair | 3 months |
| Needs Improvement | Under 3 months |
| Critical | No emergency fund |
To improve: treat the contribution like a fixed monthly bill — steady deposits matter more than an occasional large one.
4. Net Worth Growth
Net worth is what you own minus what you owe, but the number worth watching is the trend, not the total. Someone whose net worth grows steadily is generally moving toward financial independence, regardless of the starting point.
Watch for: debt growing faster than assets, or investment accounts that haven’t received a new contribution in years. To improve: review net worth quarterly rather than daily — short-term market swings say little about long-term direction.
5. Debt-to-Income Ratio
This measures how much of your monthly income goes toward debt payments — the same figure lenders use, and a useful one for your own planning too.
| Status | DTI Ratio |
|---|---|
| Excellent | Under 20% |
| Good | 20–35% |
| Fair | 36–43% |
| High Risk | Above 43% |
To improve: prioritize high-interest debt first, and avoid new borrowing unless it’s genuinely necessary.
6. Housing Cost Ratio
Housing is usually the largest monthly expense, so tracking it — rent or mortgage, taxes, insurance, and basic maintenance — as a share of gross income matters for the rest of your budget.
| Status | Housing Cost Ratio |
|---|---|
| Excellent | Under 25% |
| Good | 25–30% |
| Acceptable | 30–35% |
| Needs Attention | Above 35% |
To improve: look at total housing costs, not just the mortgage — refinancing where appropriate, cutting utility costs, or reconsidering housing that outpaces income can all help.
7. Investment Growth Rate
Wealth-building isn’t only about saving — it’s also about growth through market gains, dividends, and consistent contributions. Long-term trends matter far more here than daily market movement.
| Status | Annual Investment Growth |
|---|---|
| Excellent | 10%+ (long-term average) |
| Good | 7–10% |
| Average | 5–7% |
| Needs Review | Below 5% |
Returns vary by investment type and market conditions. To improve: focus on consistent contributions rather than trying to time the market.
8. Retirement Progress
Delaying retirement contributions costs more than the amount not saved — it costs the compound growth that money would have earned. Rather than comparing yourself to a generic target, ask whether you’re contributing consistently, increasing contributions over time, and further along than you were a year ago.
Watch for: no retirement savings, contributions that stop for long stretches, or frequent early withdrawals. To improve: increase contributions whenever income rises — small, regular increases compound more than a delayed lump sum.
9. Passive Income Percentage
This tracks how much of your income comes from sources that don’t require ongoing active work — rental income, dividends, royalties, or a business that runs without your daily involvement.
| Status | Passive Income |
|---|---|
| Excellent | 30%+ of total income |
| Good | 15–30% |
| Growing | 5–15% |
| Beginner | Below 5% |
Most people start at 0% — that’s a normal starting point, not a warning sign on its own. To improve: build one reliable stream before trying to diversify into several.

10. Insurance Protection Score
Insurance isn’t about growing wealth — it’s about protecting what you’ve already built. Rather than counting policies, evaluate whether your biggest financial risks (health, auto, home, life if others depend on your income, disability, and business coverage if self-employed) are actually covered and current.
Watch for: outdated policies, coverage gaps, or major life changes — marriage, a new home, children — that haven’t been reflected in your policies yet. To improve: review coverage once a year or after any significant life event.
11. Financial Freedom Score
This combines everything above into one overall picture. It doesn’t require becoming a millionaire — it means having enough stability that money creates options instead of ongoing stress. Ask yourself: can I comfortably pay my bills, do I have emergency savings, am I investing consistently, is my debt manageable, would losing one paycheck create a crisis, could I take time off without immediate hardship?
| Score | Financial Position |
|---|---|
| 90–100 | Financially Independent |
| 75–89 | Financially Strong |
| 60–74 | Stable but Improving |
| 40–59 | Needs Attention |
| Below 40 | High Financial Risk |
To improve: steady progress across several metrics tends to move this score more than a dramatic push in just one area.
Sample Dashboard Scorecard
Bringing all 12 metrics into one table turns scattered accounts and statements into a single view you can review in minutes each month.
| Financial Metric | Current Value | Target | Status | Action Needed |
|---|---|---|---|---|
| Monthly Cash Flow | $650 | $1,000 | Good | Reduce discretionary spending |
| Savings Rate | 14% | 20% | Good | Increase automatic transfers |
| Emergency Fund | 4 months | 6 months | Improving | Continue monthly contributions |
| Net Worth Growth | +8% | +12% | Good | Increase investing |
| Debt-to-Income Ratio | 31% | Under 25% | Fair | Pay down high-interest debt |
| Housing Cost Ratio | 28% | Under 30% | Healthy | Maintain current budget |
| Investment Growth | +9% | +10% | Good | Stay consistent |
| Retirement Progress | 63% | 100% | Improving | Increase yearly contributions |
| Passive Income | 7% | 20% | Growing | Build additional income streams |
| Insurance Protection | 82% | 100% | Good | Review policy coverage |
| Financial Freedom Score | 71 | 90+ | Improving | Focus on savings and debt |
Recreate this in a spreadsheet, a notebook, or a printable worksheet — the format matters less than actually updating it every month.
Healthy Benchmarks at a Glance
| Financial Metric | Excellent | Good | Average | Needs Improvement |
|---|---|---|---|---|
| Monthly Cash Flow | 20%+ remaining | 10–20% | 5–10% | Below 5% |
| Savings Rate | 20–30% | 15–20% | 10–15% | Under 10% |
| Emergency Fund | 6–12 months | 4–6 months | 3 months | Under 3 months |
| Debt-to-Income Ratio | Under 20% | 20–35% | 36–43% | Above 43% |
| Housing Cost Ratio | Under 25% | 25–30% | 30–35% | Above 35% |
| Credit Utilization | Under 10% | 10–30% | 30–50% | Above 50% |
| Investment Growth | 10%+ | 7–10% | 5–7% | Below 5% |
| Passive Income | 30%+ | 15–30% | 5–15% | Under 5% |
| Financial Freedom Score | 90–100 | 75–89 | 60–74 | Under 60 |
These ranges aren’t meant to discourage — they’re a reference point for deciding where improvement would have the biggest impact.
Warning Signs Hidden Inside Your Dashboard
A dashboard’s real value is catching problems before they become emergencies. A few patterns are worth watching closely:
- High income, negative cash flow. A large paycheck doesn’t guarantee security — spending consistently above income erodes financial ground no matter the salary attached to it.
- A declining savings rate. Often a sign of lifestyle inflation — every raise quietly becoming higher spending instead of higher savings.
- Debt growing faster than income or assets. Manageable payments today don’t guarantee flexibility tomorrow if the balance keeps climbing.
- An emergency fund that hasn’t moved in months. Even a small setback can become stressful when the cushion isn’t growing.
- Stagnant investments. Long-term wealth-building depends on ongoing contributions — a balance that hasn’t changed usually means contributions have quietly stopped.
- Housing costs consuming more of income over time. When housing takes too large a share, saving, investing, and paying down debt all get harder simultaneously.
Reviewing Your Dashboard Every Month
Building a dashboard is only step one — its value comes from checking it consistently. Most financially organized households don’t spend hours on this; a focused 20 to 30 minutes is usually enough.
- Update every number. Pull current income, expenses, savings, investments, and debt balances into the dashboard.
- Compare with last month. Is the savings rate improving? Has debt decreased? Is cash flow stronger? Progress matters more than any single perfect number.
- Look for trends, not isolated events. Grocery spending climbing steadily, or investment deposits slowly improving, tells a more accurate story than one unusual month.
- Choose one priority. Trying to improve all 12 metrics at once tends to backfire — pick one focus, like increasing savings by 2% or reducing discretionary spending by $100.
- Acknowledge progress. Financial improvement is built over years, not weeks — a paid-off loan or a stronger cash flow number is worth recognizing when it happens.
Quarterly and Annual Reviews
Every Quarter
Set aside one uninterrupted hour every 90 days to step back from monthly updates and look at trends: has income grown, has spending shifted in a particular category, is debt trending down, are investment contributions staying consistent, and is progress toward specific goals — an emergency fund target, a down payment, a retirement number — actually visible. If income has risen but savings haven’t followed, lifestyle inflation may already be at work.
Once a Year
A full annual audit works like a yearly financial physical. Recalculate net worth (assets minus liabilities) and compare it with last year’s figure — direction matters more than the number itself. Review whether insurance coverage still matches your current life circumstances, check retirement contributions against your goals, and organize tax-related documents while things are still fresh. Take time to note real progress too — debt eliminated, savings milestones reached, habits that have genuinely improved.
Mistakes That Undermine Financial Tracking
- Tracking too many numbers. A dashboard with fifty metrics is one people abandon — the 12 here are enough for most households.
- Obsessing over daily changes. Markets and expenses fluctuate constantly; checking every day usually creates stress without adding useful information.
- Ignoring long-term trends. A single bad month rarely determines financial outcomes — three years of rising debt or falling savings deserves far more attention.
- Comparing yourself to others. A dashboard measures your own progress against your own past results, not against friends, coworkers, or social media.
- Collecting data without acting on it. Reviewing a stagnant savings rate for six months without changing anything defeats the purpose — every review should end with at least one concrete step.
Habits Behind Financially Organized Households
Financial progress usually comes from small, repeatable habits rather than one big decision. A few show up consistently among households that manage money well:
- A recurring monthly money check-in, rather than only discussing finances during a crisis.
- Automating good decisions — savings transfers, investment contributions, and bill payments that happen without requiring a fresh decision each time.
- Treating emergencies as inevitable, not surprising, and relying on prepared savings instead of credit when they happen.
- Controlling lifestyle inflation by directing part of every raise toward savings and investments instead of new spending.
- Keeping financial documents organized — insurance policies, tax records, loan agreements — so decisions don’t stall on missing paperwork.
- Investing consistently rather than waiting for ideal market conditions.
- Reviewing goals as circumstances change, since priorities shift with life stages — from a home down payment to retirement to education costs.
Building Your Own Dashboard in Under 30 Minutes
No special software is required. A few practical options:
- Spreadsheet: Columns for metric, current value, target, previous month, status, and notes — updated once a month.
- Notebook: A dedicated page for monthly numbers, useful for anyone who prefers writing things out by hand.
- Printable dashboard: Kept in a financial binder for a quick monthly update.
Monthly Dashboard Checklist
- Did income increase?
- Was cash flow positive?
- Did savings happen consistently?
- Did debt decrease?
- Did investments grow?
- Is the emergency fund stronger?
- Am I closer to this year’s financial goals?
Mostly “yes” answers mean the overall direction is healthy — a mixed answer simply points to where next month’s focus should be.
Frequently Asked Questions
Do all 12 metrics need to be tracked from day one?
No — starting with three or four, like cash flow, savings rate, emergency fund, and debt-to-income ratio, is a reasonable entry point, with the rest added once the habit sticks.
What if my metrics look good individually but I still feel financially stressed?
The dashboard reflects measurable financial indicators, not day-to-day feelings — stress can come from factors outside the numbers, like job uncertainty or family circumstances, even when the underlying figures are solid.
How do self-employed or irregular incomes affect these metrics?
Irregular income makes cash flow and emergency fund coverage more important to watch closely, since a “healthy month” benchmark may not apply evenly across months with uneven earnings — averaging figures over a quarter often gives a clearer picture than any single month.
Should I track my dashboard separately from my partner’s, or combine them?
Both work. A combined dashboard reflects total household finances, while separate tracking can help identify which partner’s habits or goals need particular attention — many couples do a version of both.
What’s a reasonable first goal if most of my metrics fall in the “needs improvement” range?
Pick one metric, usually cash flow or emergency fund coverage, since progress there tends to make the other metrics easier to improve afterward.
Does a rising Financial Freedom Score guarantee financial security?
No single score guarantees anything — it’s a snapshot built from measurable indicators, useful for tracking direction over time rather than predicting outcomes with certainty.
How is this different from a Financial Stability Score?
They overlap in purpose but differ in structure — a stability score condenses financial health into one weighted total, while this dashboard tracks 12 individual metrics separately, which makes it easier to see exactly which specific area needs attention.
Final Thoughts
Financial progress depends less on luck than on awareness, consistency, and informed decisions. A personal finance dashboard turns abstract ideas like “financial health” into specific numbers you can track, understand, and act on.
No dashboard looks perfect on day one, and your numbers will keep shifting as income, responsibilities, and goals evolve. The point isn’t a flawless scorecard — it’s building the habit of checking in regularly and adjusting course before small issues become bigger ones.