

That gap is the real question behind “does the 50/30/20 rule still work in 2026” — not whether the framework is fundamentally broken, but whether the specific percentages still match what things actually cost. The short answer: the structure holds up fine as a way of thinking about money. The exact 50/30/20 split is a much tighter fit for some households than others.
Quick Answer: Does the 50/30/20 Rule Still Work?
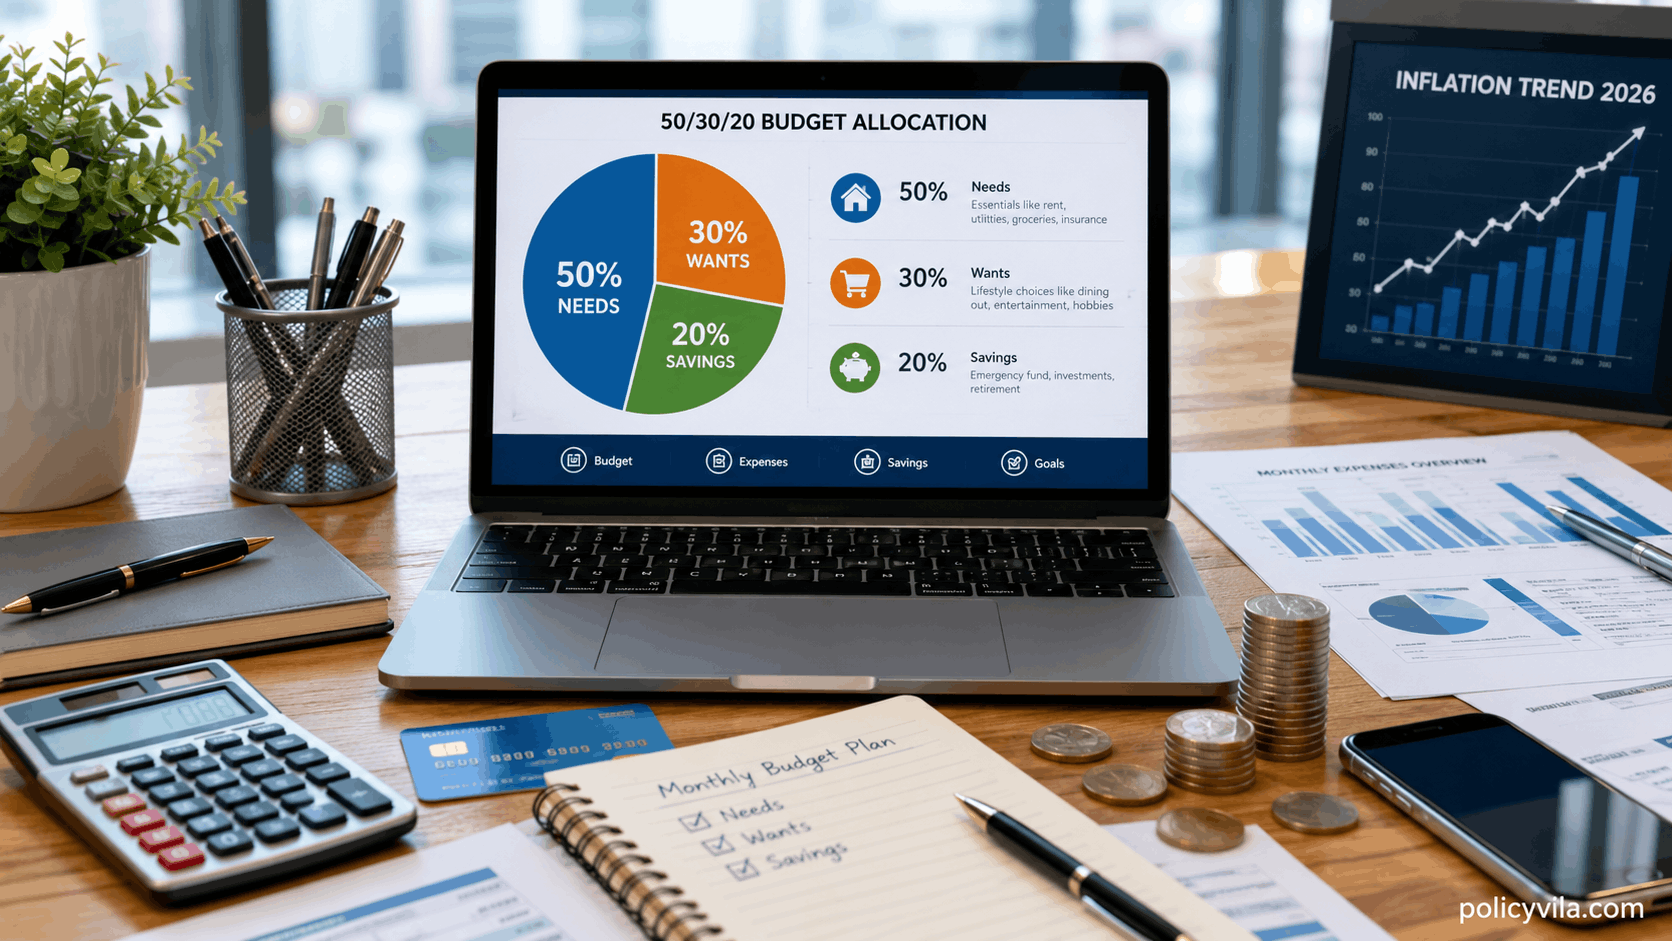
The 50/30/20 rule — allocating roughly 50% of after-tax income to needs, 30% to wants, and 20% to savings and debt repayment — remains a widely used budgeting framework, and the Consumer Financial Protection Bureau includes it among the general budgeting approaches it discusses in its own consumer guidance. But it was never meant to be a rigid formula, and current cost-of-living data backs that up: shelter alone carries roughly a third of the weight in the Bureau of Labor Statistics’ Consumer Price Index and has been running above 3% year-over-year inflation through mid-2026, which means housing costs alone can push many households’ “needs” spending well past the traditional 50% mark. Most financial guidance today treats the percentages as a flexible starting point, not a strict requirement.
Table of Contents
- What the 50/30/20 Rule Actually Is
- Needs, Wants, and Savings: Where the Line Actually Falls
- Why the Rule Became So Popular
- Where Today’s Costs Push Past the Traditional Split
- Two Household Examples
- When the Rule Fits Well
- When It Needs More Adjustment
- Alternative Budgeting Methods
- Comparing the Methods
- Practical Ways to Adapt the Rule
- Pros and Cons
- Common Budgeting Mistakes
- Monthly Budget Checklist
- Frequently Asked Questions
What the 50/30/20 Rule Actually Is
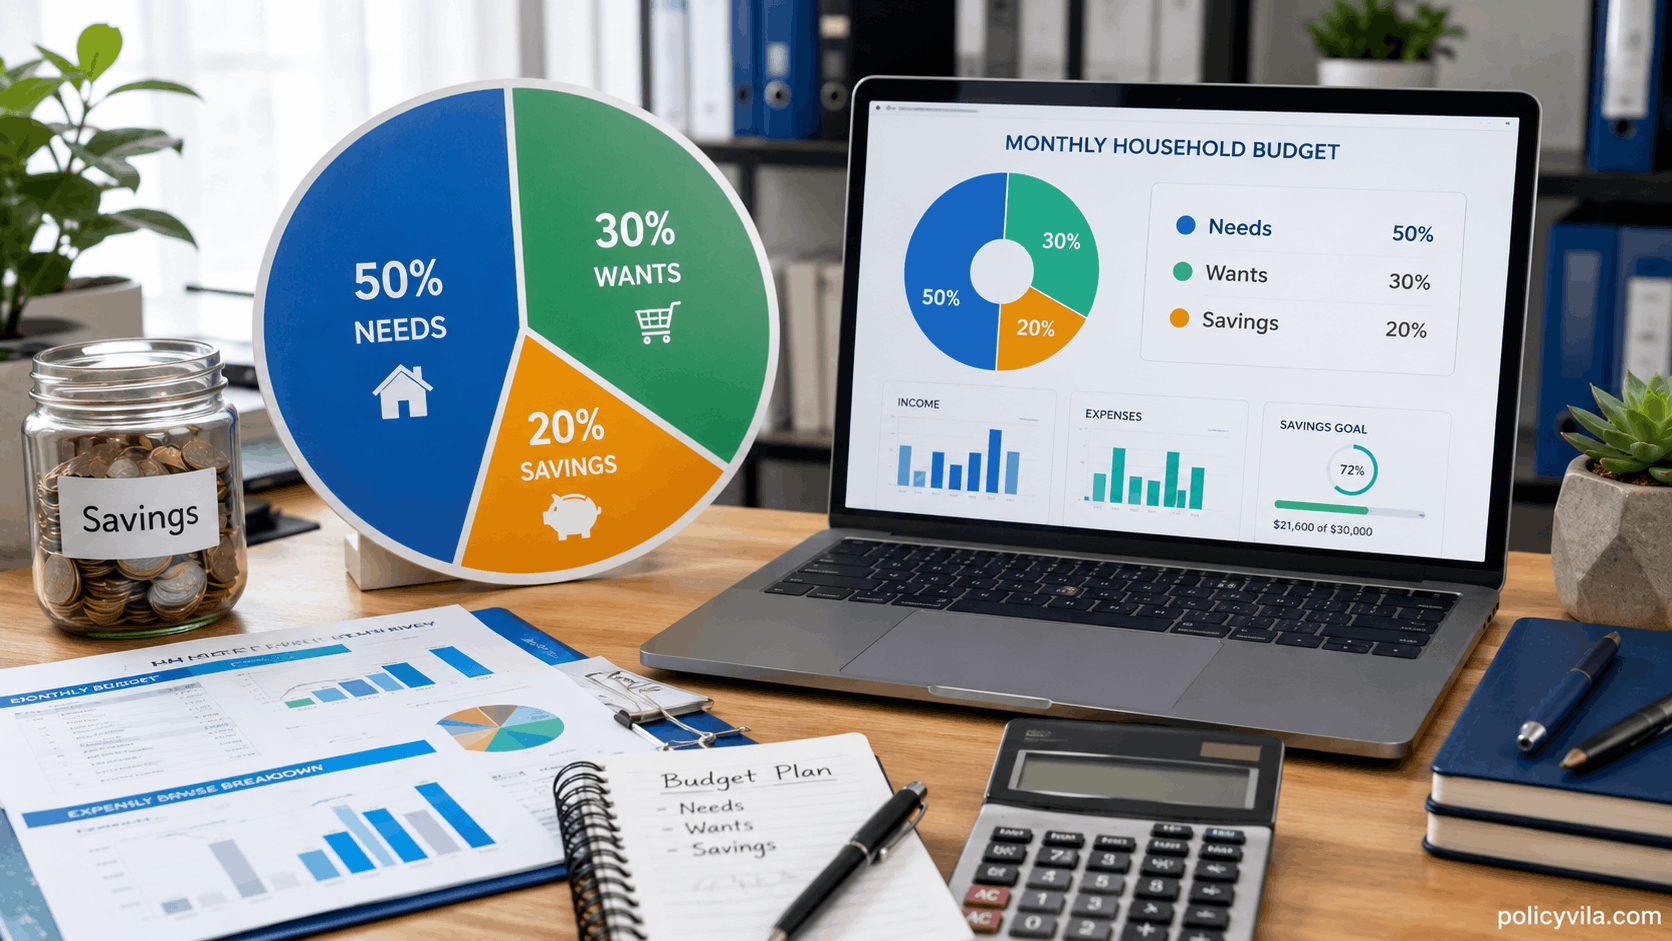
The 50/30/20 rule divides after-tax monthly income into three broad categories:
| Category | Target Share | Purpose |
|---|---|---|
| Needs | 50% | Essential living expenses |
| Wants | 30% | Lifestyle and discretionary spending |
| Savings & debt repayment | 20% | Emergency fund, retirement, investing, extra debt payments |
On a $5,000 monthly take-home income, that works out to roughly $2,500 for needs, $1,500 for wants, and $1,000 for savings and debt. The percentages are meant as general guidance, not an exact formula — the CFPB itself presents the 50/30/20 split as one flexible way to approach a spending plan, not a mandatory rule.
Needs, Wants, and Savings: Where the Line Actually Falls
Needs
Needs are expenses that affect your basic stability if they go unpaid: rent or mortgage, property taxes, utilities, groceries, health insurance, car insurance, basic transportation, prescription medications, minimum debt payments, childcare, and internet required for work. This category usually consumes the largest share of any household’s budget — often the entire reason the percentages feel tight.
Wants
Wants improve quality of life without being essential: dining out, streaming subscriptions, vacations, gym memberships, entertainment, hobbies, and similar discretionary spending. This is usually the most flexible category — the one people trim first when money is tight.
Savings and debt repayment
This covers emergency fund contributions, retirement accounts, investments, extra debt payments beyond the minimum, and other progress toward longer-term financial goals. Treating this category like a fixed monthly bill — and automating the transfer — tends to produce more consistent results than saving whatever happens to be left over.
Why the Rule Became So Popular
The 50/30/20 rule’s staying power comes down to simplicity. Instead of tracking dozens of spending categories, it organizes an entire budget into three broad buckets that almost anyone can calculate in a few minutes. It also works across income levels — the dollar amounts change, but the percentages don’t — and it explicitly leaves room for discretionary spending rather than demanding total austerity, which tends to make it easier to stick with over time than more restrictive systems.
Where Today’s Costs Push Past the Traditional Split
The core criticism of the 50/30/20 rule in 2026 isn’t that the underlying logic is wrong — it’s that essential costs in several categories have grown faster than the “50% for needs” assumption comfortably allows for many households.
According to the Bureau of Labor Statistics, the shelter index — the single largest component of the Consumer Price Index, carrying roughly a third of its overall weight — rose about 3.2% to 3.4% year-over-year through mid-2026, continuing several years of above-average housing cost growth. Food prices have moved in the same direction: BLS data shows the overall food index rose 3.1% in 2025, with food away from home climbing 4.1% — both faster than the prior year. Utility costs have been uneven but sometimes sharp: electricity rose 6.7% and natural gas jumped 10.8% over the same period.
None of this means the 50/30/20 framework has become useless. It means the “needs” category has genuinely gotten more expensive relative to income for a lot of households, especially in high-cost housing markets or homes with childcare expenses — both of which fall squarely under “needs” and don’t have much room for reduction.
| Cost Category | Recent Trend (BLS data) |
|---|---|
| Shelter | ~3.2–3.4% year-over-year as of mid-2026; ~one-third of the overall CPI basket |
| Food (overall) | +3.1% in 2025, accelerating from +2.5% in 2024 |
| Food away from home | +4.1% in 2025 |
| Electricity | +6.7% over the trailing 12 months |
| Natural gas | +10.8% over the trailing 12 months |
Many households in high-cost areas or with significant childcare expenses find their actual split looks closer to 60–70% needs, 15–20% wants, and 10–20% savings. That’s a deviation from the textbook version, not necessarily a sign of poor money management — it often just reflects the categories genuinely being more expensive right now.
[Relevant image: household budget breakdown comparing needs, wants, and savings percentages against rising living costs]
Two Household Examples
These are illustrative examples, not universal outcomes — every household’s numbers will differ.
Single professional, no dependents
| Category | Monthly Amount |
|---|---|
| Take-home income | $4,500 |
| Needs (rent, utilities, groceries, insurance, transportation) | $2,100 (47%) |
| Wants (dining out, subscriptions, travel, fitness) | $1,250 (28%) |
| Savings (emergency fund, retirement, investing) | $1,150 (26%) |
With no dependents and moderate living costs, this budget lands close to the traditional percentages without much strain.
Family with two children
| Category | Monthly Amount |
|---|---|
| Take-home income | $8,500 |
| Needs (mortgage, childcare, groceries, insurance, school costs, utilities) | $5,900 (69%) |
| Wants (dining out, entertainment) | $1,100 (13%) |
| Savings | $1,500 (18%) |
This family’s needs run nearly 20 percentage points above the traditional guideline — largely driven by childcare and housing — while wants shrink to make room. They’re still saving consistently and managing money responsibly; they’re just working with a different ratio than the textbook version.
When the Rule Fits Well
- Young professionals early in their careers — fewer fixed obligations like childcare or a mortgage make the traditional percentages more attainable.
- Households with stable, predictable income — salaried employment makes planning around fixed percentages considerably easier than variable income does.
- Residents of moderate cost-of-living areas — lower housing and insurance costs leave more room within the 50% needs target.
- People new to budgeting — the simplicity of three categories makes it a reasonable starting point before moving to something more detailed.
- Households with little existing debt — without large loan payments competing for the “needs” or “savings” categories, hitting 20% savings is more realistic.
When It Needs More Adjustment
- Freelancers and gig workers — irregular income makes fixed monthly percentages harder to apply; budgeting off an average annual income often works better.
- Seasonal workers — industries like tourism, agriculture, or holiday retail see dramatic income swings that a flat monthly split doesn’t accommodate well.
- Larger families — childcare, school costs, and larger grocery bills can push needs well past 50% simply due to household size.
- Residents of high-cost metro areas — housing, parking, insurance, and childcare costs can be substantially higher than the national averages the rule assumes.
- Households aggressively paying down debt — some intentionally shift toward something like 50% needs, 15% wants, 35% debt-and-savings to accelerate payoff.
- Early retirement or FIRE-focused savers — those pursuing aggressive savings goals often run something closer to 45% needs, 15% wants, 40% savings and investing.
Alternative Budgeting Methods
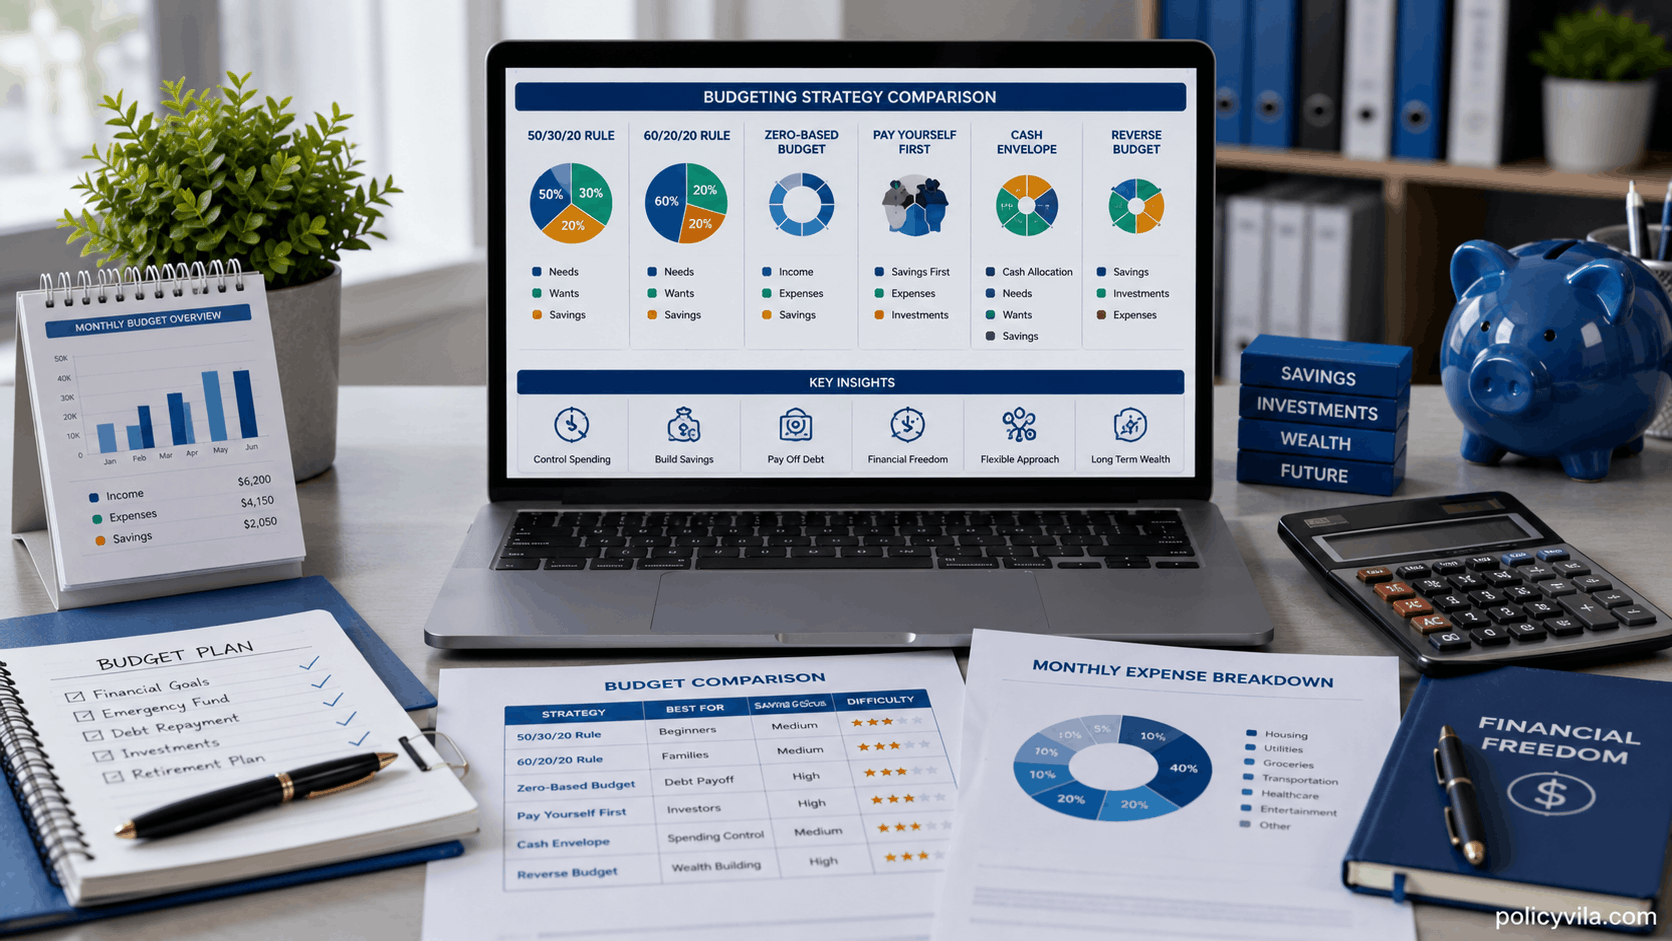
The 60/20/20 budget
A straightforward adjustment that allocates 60% to needs, 20% to wants, and 20% to savings — a more realistic fit for households in higher cost-of-living areas or with significant childcare expenses, at the cost of less flexibility to trim essential spending.
Zero-based budgeting
Every dollar of income is assigned a specific job — bills, savings, debt, discretionary spending — until income minus allocations equals zero. It offers the most spending control and works particularly well for debt payoff, but requires more active tracking than a percentage-based approach.
Pay yourself first
Rather than budgeting every expense category, this method transfers a set amount to savings and investing the moment income arrives, then covers spending with what’s left. It’s simple to automate but doesn’t directly address spending habits the way a category-based budget does.
Cash envelope method
Discretionary spending categories — groceries, dining, entertainment — are funded with physical cash in separate envelopes; once an envelope is empty, spending in that category stops for the month. Effective for curbing overspending, though less practical for a household that does most of its shopping online.
Reverse budgeting
Savings, investing, and debt reduction are funded first, with remaining income covering discretionary spending afterward — essentially “pay yourself first” applied more formally across multiple financial goals. It requires discipline upfront but tends to build wealth faster for those who stick with it.
Comparing the Methods
| Method | Best For | Difficulty | Savings Focus |
|---|---|---|---|
| 50/30/20 rule | Beginners, stable income | Easy | Moderate |
| 60/20/20 rule | Families, high-cost areas | Easy | Moderate |
| Zero-based budget | Debt repayment, detailed control | Moderate | High |
| Pay yourself first | Automated, hands-off savers | Easy | Very High |
| Cash envelope | Curbing overspending | Moderate | Moderate |
| Reverse budget | Aggressive wealth building | Moderate | Very High |
None of these is universally “better” — the right one depends on your income stability, how much structure you want, and whether your struggle is overspending, under-saving, or inconsistent income.
Practical Ways to Adapt the Rule
Reduce fixed costs where you actually can
Shopping around for insurance, refinancing high-interest debt, negotiating recurring bills, and cutting unused subscriptions can meaningfully shrink the “needs” category over time, even when the biggest line items — rent, childcare — aren’t easily reduced.
Automate savings before it can be spent
Automatic transfers to an emergency fund, retirement account, or investment account remove the temptation to treat savings as an afterthought.
Track spending for a full month
Small, frequent purchases — coffee, delivery fees, forgotten subscriptions — often add up to more than people expect. A month of honest tracking usually reveals adjustable spending that a general budget overview misses.
Build an emergency fund deliberately
A cushion of a few months of essential expenses prevents a single unexpected cost — a repair, a medical bill — from turning into new debt.
Review the budget monthly, adjust the percentages as needed
Income changes, a new expense, or a shift in priorities are all reasons to revisit the split rather than forcing last year’s percentages onto this year’s numbers.
Watch for lifestyle inflation
As income rises, it’s easy to let spending rise right along with it. Directing part of any raise toward savings before it becomes new spending helps keep the ratio moving in the right direction instead of staying flat.

Pros and Cons
| Pros | Cons / Limitations |
|---|---|
| Simple enough to calculate and follow without detailed tracking | The exact percentages can be unrealistic in high-cost housing markets |
| Leaves deliberate room for discretionary spending, which supports consistency | Doesn’t account well for irregular or seasonal income |
| Scales across income levels using the same basic structure | Large childcare or medical costs can push “needs” well past 50% |
| Encourages savings as a built-in category rather than an afterthought | Offers less granular control than zero-based or envelope budgeting |
Common Budgeting Mistakes
Forcing the exact percentages regardless of your actual costs
Fix: Use 50/30/20 as a starting point, then adjust the ratio to reflect your real housing and childcare costs rather than treating the split as mandatory.
Ignoring irregular expenses
Fix: Divide annual costs like insurance premiums, vehicle registration, and property taxes into monthly amounts so they don’t arrive as surprises.
Skipping the emergency fund entirely
Fix: Even a small, steadily growing cushion reduces how often an unexpected cost turns into new debt.
Letting subscriptions and recurring charges go unreviewed
Fix: A periodic review of recurring charges often turns up services that are no longer worth what they cost.
Not revisiting the budget after life changes
Fix: A new job, a move, a child, or a change in debt load all justify reworking the percentages rather than sticking with an outdated plan.
Relying on credit cards to cover routine shortfalls
Fix: If a “needs” or “wants” category regularly requires credit to cover, that’s a sign the underlying budget needs adjusting, not just the payment method.
Monthly Budget Checklist
- Calculate actual take-home income for the month
- List and total all needs expenses, including irregular ones divided monthly
- List and total discretionary “wants” spending
- Confirm savings and debt repayment happened — automated if possible
- Compare your actual percentages against your target split
- Identify one category that could realistically shift, if any
- Review recurring subscriptions and cancel unused ones
- Adjust next month’s targets based on any income or expense changes

Frequently Asked Questions
Is the 50/30/20 rule outdated in 2026?
Not outdated so much as tighter to hit exactly. Rising shelter and food costs — both well-documented in recent Bureau of Labor Statistics data — mean many households’ “needs” spending naturally runs higher than 50%, but the underlying framework of balancing essentials, discretionary spending, and savings still applies.
Can the 50/30/20 rule work on a lower income?
It can, though hitting a full 20% savings rate may not be realistic right away. Covering essential needs first and gradually increasing the savings percentage as income allows is a more sustainable approach than forcing the full split immediately.
Should retirees use a different version of the rule?
Many do, since retirement income sources, healthcare costs, and the absence of ongoing retirement savings needs change the picture. A modified split that reflects fixed retirement income and higher healthcare spending often fits better than the working-age version.
How much should an emergency fund hold?
A commonly cited range is three to six months of essential expenses, though the right amount depends on job stability, household size, and other available financial resources.
Is it fine to permanently use different percentages, like 60/20/20?
Yes — many households successfully use a modified split long-term rather than treating 50/30/20 as the only acceptable ratio. What matters more than the exact numbers is spending less than you earn and saving consistently.
How often should I revisit my budget?
Monthly reviews catch smaller issues early, while larger adjustments are worth making whenever income, major expenses, or financial goals change meaningfully.
Does a high income mean budgeting isn’t necessary?
No — a higher income doesn’t prevent spending from rising to match it. Budgeting helps ensure savings actually grow alongside income rather than lifestyle costs quietly absorbing every raise.
Which budgeting method is objectively best?
There isn’t one that fits everyone. The most effective budget is the one a person can actually follow consistently — for some that’s the simplicity of 50/30/20, for others it’s zero-based budgeting or a cash envelope system.
Final Thoughts
The 50/30/20 rule remains one of the simplest, most approachable ways to organize a budget — and that simplicity is exactly why it’s stayed popular for so long. But treating the specific percentages as mandatory, rather than as a flexible starting framework, is where a lot of the frustration with the rule actually comes from. Current cost data shows shelter and food genuinely growing faster than incomes in many cases, which is a real constraint, not a personal budgeting failure.
The version of this rule that actually works long-term is the one adjusted to your real numbers: your housing costs, your childcare obligations, your income stability, and your specific financial goals. Whether that ends up looking like 50/30/20, 60/20/20, or something else entirely matters far less than whether you’re consistently spending less than you earn and building savings month over month.
1 thought on “The 50/30/20 Budget Rule in 2026: Does It Still Work for Modern Families?”